In part 1 of this poll review, I talked about Let's Go Brandon's impact on the 2022 midterm election cycle as well as his own chances for re-election. Now I'm going to dive a little further into the 2022 midterms. In addition to the caveats mentioned in my previous post there are some additional caveats to be made here. While the presidential job approval does not accurately predict the outcome of a presidential election as the election is actually set up as individual elections, it is still directionally accurate. When you look at congressional races there are 435 individual races. So looking at a generic ballot is going to help even less with the outcome as to the makeup of the next congress. Nevertheless, there is a correlation between the generic congressional ballot and what will happen in the midterms. There is a directional view that can be helpful to outcome prediction.
Let's start with the congressional job approval ratings. They're terrible. Consistently. But that is nothing new and it makes sense; not only are the voters who support the party out of power negative, but the party in power will always have a contingent of their own voters who think that their congress is not getting enough done. In my opinion this is the least predictive congressional polling being done. However there is some directional value to be determined from it.
As you can see below the long term trend, while flattish, does have some slight U-shaped disapproval and the reverse for disapproval.
But if you zero in on the current congress, you can see that the post-election honeymoon seemed to have peaked in April 2021. Since then congressional approval has generally swung downward from about 36% to about 21%.
These polls tend to be mostly among registered voters. The effect of such negatives can be twofold. It can dampen enthusiasm and thus turnout, more so for the party in power, and also, it can energize voters in the party out of power. Much of that energy is directed at presidential approval and this is part of why we see the presidents' parties typically lose seats in midterm elections. Of course there are exceptions for various reasons. As the most recent examples, president Obama was shellacked in his first midterm election and in his second, Republicans made even further gains. Not exactly good news for Democrats. Donald Trump even more recently, started with Republicans in control of both congress and the senate. Despite his economic performance a hostile media ensured Republicans would lose ground during president Trump's midterm. And they did; Democrats took a thin majority of Congress. Leading up to the midterms what is somewhat more informative is the generic congressional vote. It is merely directional but when they are this stark, they mean something. Republicans lead on this metric, and that is not common.
Consider also that the polls have consistently overstated Democrat support in these polls. Well, at least that's the narrative and we should be somewhat wary here. Taking a look at the RCP average congressional ballot spread versus the actual outcomes tells a slightly different story.
Midterms
2018: RCP average DEM +7.3% / Actual result DEM +8.4% - Democrat polling was understated by 1.1% [counters hypothesis]
2014: RCP average REP +2.4% / Actual result REP +5.7% - Republican polling was understated by 3.3% [matches hypothesis]
2010: RCP average REP +9.4% / Actual result REP +6.8% - Republican polling was overstated by 3.6% [counters hypothesis]
2006: RCP average DEM +11.5% / Actual result DEM +7.9% - Democrat polling was overstated by 3.6% [matches hypothesis]
2002: RCP average REP +1.7% / Actual result REP +4.6% - Republican polling was understated by 3.9% [matches hypothesis]
On Election Cycle
2020: RCP average DEM +6.8% / Actual result DEM +3.1% - Democrat polling was overstated by 3.7% [matches hypothesis]
2016: RCP average DEM +0.6% / Actual result REP +1.1% - Democrat polling was overstated by 1.7% [matches hypothesis]
2012: RCP average REP +0.2% / Actual result DEM +1.2% - Democrat polling was understated by 1.4% [counters hypothesis]
2008: RCP average DEM +9.0% / Actual result DEM +10.7% - Democrat polling was understated by 1.7% [counters hypothesis]
2004: RCP average Tie / Actual result REP +2.6% - Republican polling was understated by 2.6% [matches hypothesis]
Overall in these 10 congressional cycles, there were 6 times the "Republican support is understated" hypothesis was supported and 4 times it was not correct. That's pretty weak. If we remove the 2 election cycles with the Obama halo effect (2008 and 2012) then we have 6 hypothesis matches and only two that counter it. That's a stronger correlation but not absolute.
In fact if we look at strictly midterm cycles, which is what we are most interested in, we have 3 matches and 2 counters, back to our original ration of 60% accurate to the hypothesis. If we suggest that the polling firms and media have learned their lesson discard the 2018 midterm, our ratio is a little better but then how do we explain the 2020 variance?
Also worth considering is the fact that Republican understated support during midterms happened only 3 out of 5 times and not in the latest midterm cycle. That is directional at best, not conclusive.
To me this hypothesis, while valid and plausible, still seems statistically weak and unproven. If you look at all of the variances what is more interesting is that variance between predicted and actual results never exceeds 3.9%. And in the midterms the variance has been decreasing cycle over cycle. This differs from the presidential election cycles, likely because more resources can be assigned to congressional polls instead of being split with presidential polling.
Let's assume that the polling on midterm cycles has improved as the trend seems to indicate. And let's assume that it is going to turn out relatively close to the 2018 cycle. And further, let's assume that it could either match or counter the hypothesis. If we are currently sitting at Republicans +2.5% that could mean we are actually sitting at a low of Republicans +1.4% or as high as Republicans +3.6% Our closest approximation for best the case is 2014 (Republicans won 247 seats to 188 for the Democrats). For the worst case the best approximation was 2016 (a non-midterm year) in which Republicans won 241 seats to the Democrats 191 seats. Either scenario seems pretty good but these are not the final months of the campaign. There's plenty of temporal room for poll movement yet to play out.
Lastly let's take a quick look at the Right Direction / Wrong Direction polling:
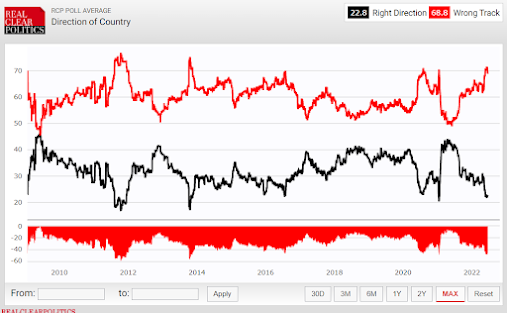
These numbers are not at levels seen since 2020 (a COVID related special case but definitely election-impacting), late 2013 (a non election year) and late 2012 (in an election cycle and one that as mentioned was an Obama halo effect year, despite being at a dip in his popularity). In 2012 they Democrats gained 8 seats but did not get a congressional majority. However in the senate they gained 2 seats and did become the majority.
If there is any correlation of Wrong Direction to the congressional outcome then this skews slightly in the Republicans favor. But the stronger mirror as noted above is probably the 2014 generic congressional vote indicator. 2014 was considered a Republican wave election. But that means that the Republican support understatement hypothesis has to be true to see that sort of result.
Yes I'm optimistic about the midterms, but still very cautiously so.
Part 3 coming tomorrow.


No comments:
Post a Comment
Disagreement is always welcome. Please remain civil. Vulgar or disrespectful comments towards anyone will be removed.